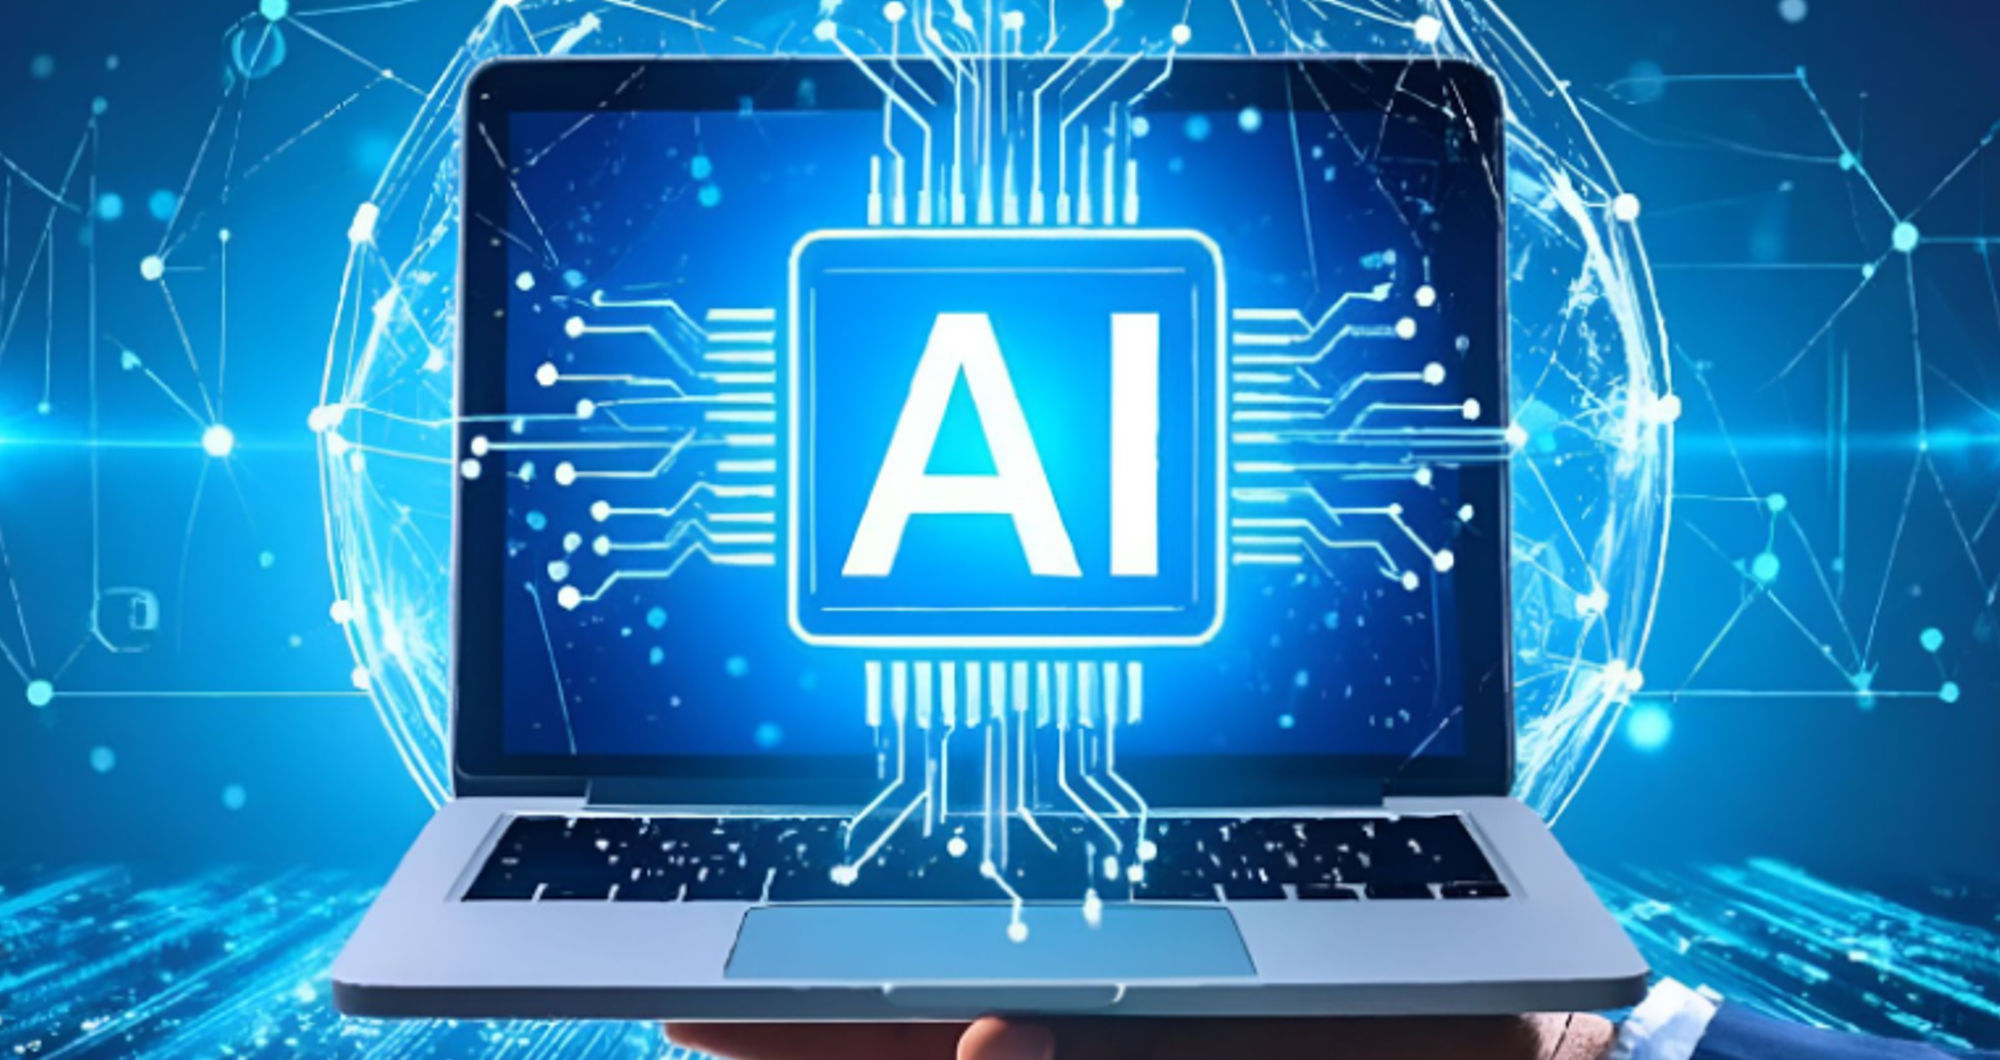

Your laptop just got smarter. The latest AI-powered devices now think and adapt while you work. They process tasks differently from traditional computers. These machines rely on runtime execution graphs to manage their operations. Think of these graphs as the brain’s neural pathways, but for your laptop. They map out how your device handles everything from opening apps to running complex AI models.
Each graph serves a specific purpose. Some optimise your battery life while others speed up your workflow. The technology works silently in the background. You might not see it, but you definitely feel the difference. These seven execution graphs transform ordinary laptops into intelligent companions that learn from your habits and boost your productivity every single day.
What Makes Runtime Execution Graphs Essential
Runtime execution graphs form the backbone of modern AI laptops. These structures organise how your device processes information in real-time. They create pathways for data to flow efficiently through your system. Traditional computers follow fixed instruction sets. An AI-powered smart laptop adapts its execution patterns based on what you’re doing and dynamically reallocates work between the CPU, GPU, and NPU to maintain the best balance between performance, power efficiency, and responsiveness.
The graphs monitor every operation your laptop performs. They track which applications you use most frequently. Your device learns from these patterns. This learning helps predict what you’ll need next. The system then allocates resources accordingly.
How Execution Graphs Improve Performance
Performance optimisation happens automatically through these graphs. Your laptop doesn’t waste processing power on idle applications. Instead, it focuses energy where you need it most. Games get more GPU resources. Video calls receive priority bandwidth. Document editing runs smoothly without lag.
1. Task Priority Management Graph
This graph determines which operations deserve immediate attention. Your AI-powered MSART laptop constantly juggles multiple processes. The priority management system ranks each task by importance. Critical system functions always take precedence. User-initiated actions come next in line.
The graph evaluates several factors when setting priorities:
- Current application focus and active window status.
- Background processes and their resource requirements.
- System health monitoring and security scans.
- Network activity and data synchronisation tasks.
- Battery level and power management needs.
Your video conference never stutters because this graph ensures stable performance. Downloads continue in the background without affecting your work. The system maintains responsiveness even under heavy load.
2. Neural Processing Unit Allocation Graph
AI tasks require specialised handling. The NPU allocation graph manages machine learning operations. Your laptop uses this graph to distribute AI workloads efficiently. Face recognition unlocks your device faster. Voice commands get processed locally without cloud delays.
Smart features benefit directly from this graph:
- Real-time language translation during video calls.
- Intelligent photo enhancement and object recognition.
- Predictive text that understands your writing style.
- Background noise cancellation in audio recordings.
- Automated content suggestions based on context.
The graph prevents your regular CPU from getting overwhelmed. AI operations run on dedicated neural processing hardware. Your laptop maintains peak performance across all functions.
With more businesses and individuals alike using AI-powered smart laptops, their market is continuously growing. The global market share of AI laptops (PCs) is expected to surpass $281.08 billion by 2034.
3. Memory Management and Caching Graph
RAM optimisation happens through intelligent caching decisions. This graph predicts which data you’ll need next. Frequently accessed files stay in fast memory. Rarely used applications get moved to slower storage. The transitions happen seamlessly without your knowledge.
Advanced Caching Strategies
The system learns your daily patterns over time. Morning routines trigger different caching behaviors than evening sessions. Work applications load faster during business hours. Entertainment apps get priority in the evenings. Your laptop adapts to your lifestyle automatically.
4. Power Consumption Optimisation Graph
Battery life extends through smart power management. This graph monitors energy usage across all components. Power-hungry processes are monitored, and adjustments are made accordingly; screen brightness decreases in response to good lighting conditions. Background activities slow down when you’re on battery power.
The optimisation works in multiple ways:
- Component-level power gating for unused hardware.
- Dynamic voltage and frequency scaling for processors.
- Intelligent display refresh rate adjustments.
- Network adapter sleep scheduling during inactivity.
Your device delivers hours of additional usage between charges. The graph balances performance with power efficiency perfectly.
5. Thermal Regulation and Cooling Graph
Heat management prevents performance throttling. This graph tracks temperature sensors throughout your laptop. It coordinates fan speeds with processor activity. Cooling increases before components get too hot. The system maintains optimal operating temperatures consistently.
Smart thermal decisions protect your hardware:
- Predictive cooling based on workload forecasting.
- Fan curve optimisation for noise reduction.
- Heat distribution across chassis components.
- Thermal throttling prevention through proactive measures.
- Component lifespan extension via temperature control.
Your laptop runs cooler and lasts longer. Silent operation becomes possible even during demanding tasks.
6. Network Traffic Routing Graph
Internet connectivity gets optimised through intelligent routing. This graph shows how your laptop handles network requests. Important data packets receive priority treatment. Streaming services maintain quality during downloads. Cloud backups happen when bandwidth is available.
The routing system enhances your online experience. Web pages load faster through predictive prefetching. Video calls remain stable on congested networks. Game latency stays low during competitive sessions. Your connection feels faster and more reliable.
7. Application Workflow Prediction Graph
Your laptop anticipates what you’ll do next. This graph analyses your usage patterns over time. It preloads applications before you open them. Files appear instantly when you need them. The system feels incredibly responsive and intuitive.
Workflow optimisation happens automatically:
- Application preloading based on time and context.
- Document retrieval from recent project patterns.
- Tool suggestion for specific task types.
- Workspace arrangement matches previous sessions.
- Resource allocation for predicted activities.
The learning never stops. Your laptop gets smarter with every interaction. Productivity increases as the system understands your needs better.
Conclusion
Runtime execution graphs revolutionise how AI-powered smart laptops operate today. These seven systems work together seamlessly behind the scenes. Performance improves while battery life extends naturally. Your laptop learns and evolves with your habits. The technology delivers tangible benefits you experience every day. Tasks complete faster with less effort on your part. Smart optimisation happens automatically without configuration. The future of personal computing has arrived in your hands. These execution graphs prove that AI integration creates genuinely better user experiences for everyone.