

The average UK house price fell to £296,285 in October, down 0.6 per cent on the month and 1.2 per cent on the year, according to the Lloyds house price index published on Friday 6 November. The monthly fall amounted to £1,882. The annual drop is the steepest recorded by the index since October 2023.
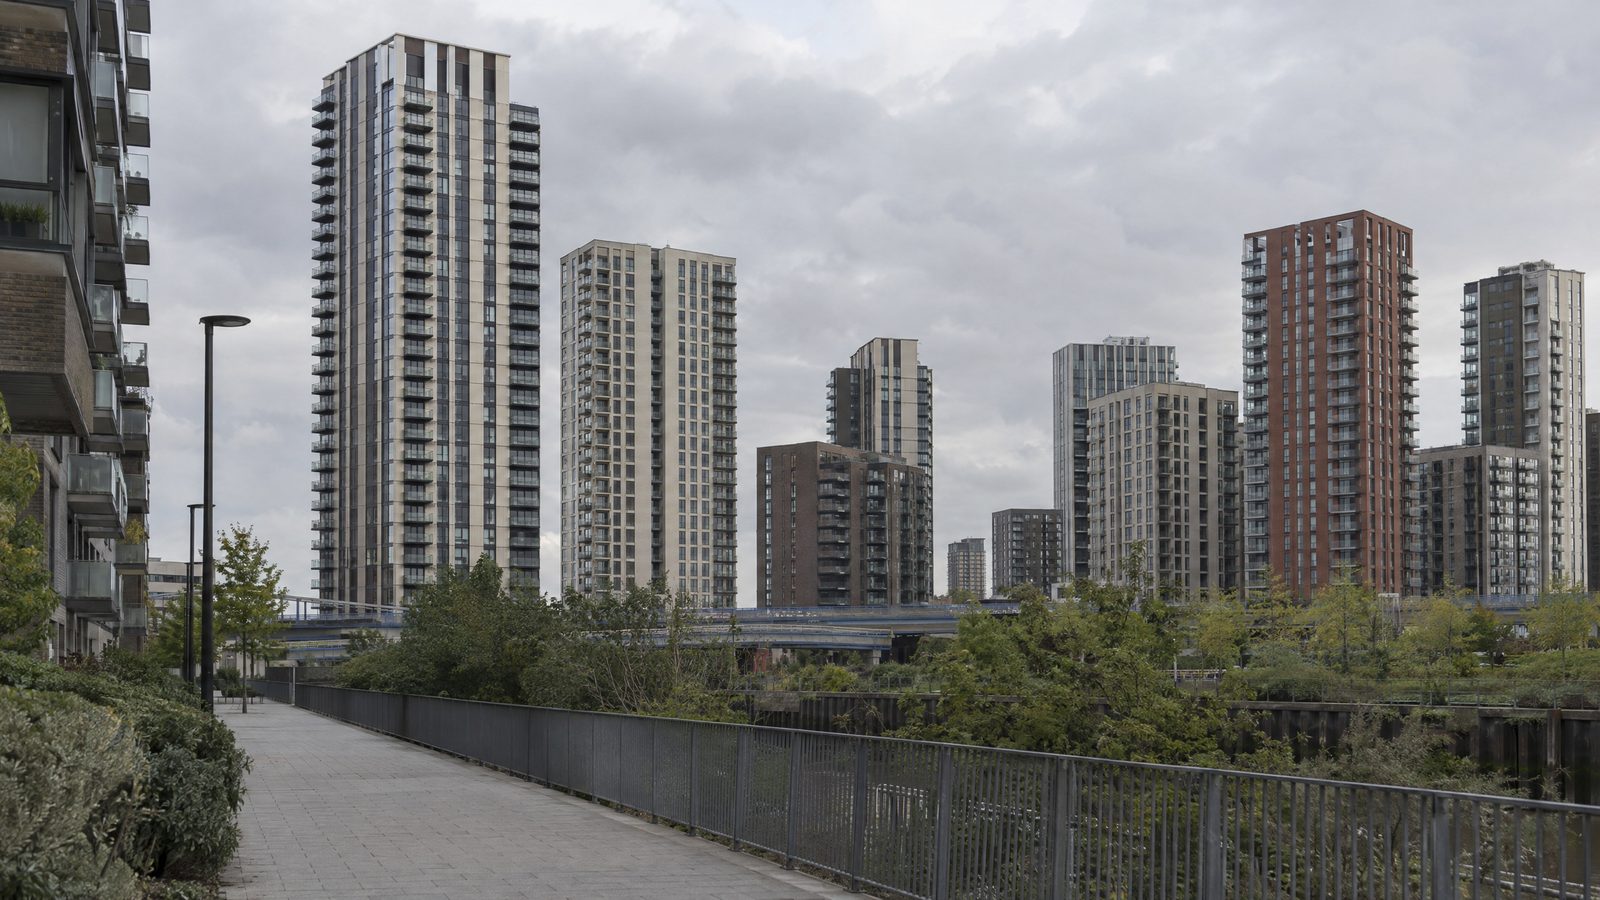
Weakness is concentrated in the south and in the capital. The average London home stands at £524,892, down 3.1 per cent over the year. The South East fell 2.4 per cent to £379,258, and Eastern England fell 2.3 per cent. Those three areas carry the most weight in the national figure, because prices are highest there and falls are measured in pounds as well as in percentages.
Two directions of travel
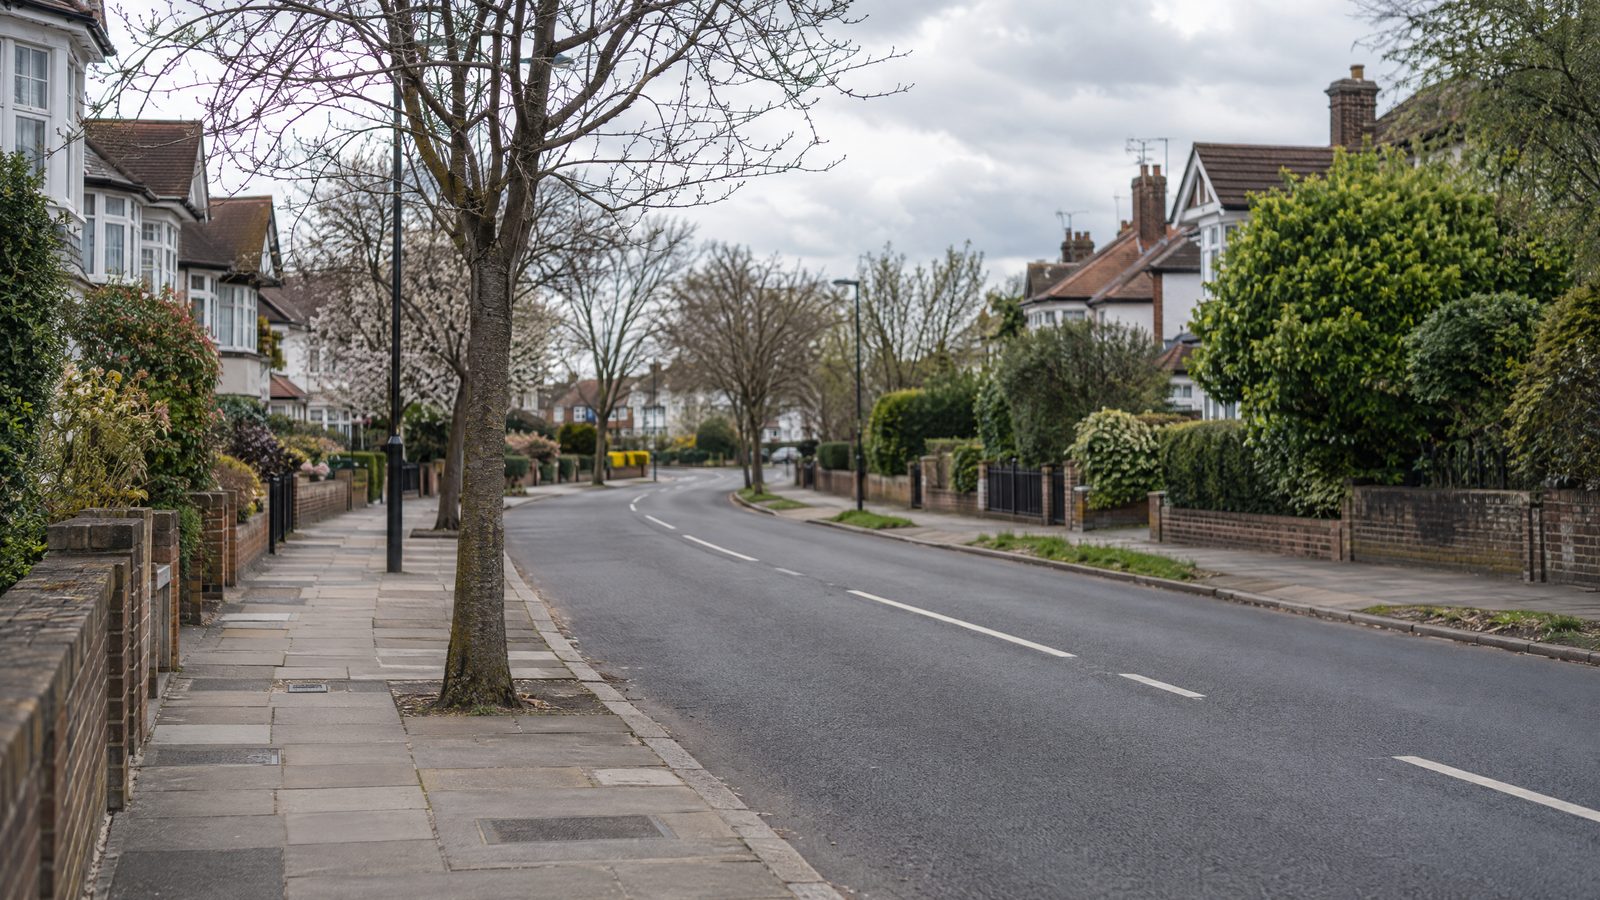
Other regions are still rising. The North West was up 2.2 per cent over the year to £249,916. Northern Ireland rose 4.4 per cent to £228,708, and Scotland rose 2.8 per cent to £222,667. The pattern is a narrowing of the gap between the most and least expensive parts of the country rather than a uniform correction.
Garrington Property Finders said the index showed average UK prices falling over six consecutive months, a run that points to momentum rather than a single weak reading. Momentum matters in housing because expectations of further falls tend to delay purchases, which in turn produces further falls.
The figures follow the Bank of England’s increase in Bank Rate to 4 per cent, the first rise since 2023. UK Finance estimated that the quarter-point increase adds about £30.72 a month to the payment on the average tracker mortgage. That estimate applies to borrowers whose payments move with the base rate, and it arrives at a point when affordability is already stretched in the markets where prices are falling fastest.
The remortgage wall
Most homeowners are insulated for now. Some 87 per cent of outstanding homeowner mortgages are on fixed rates, which means the immediate transmission of a rate rise into household budgets is limited to a minority. The delay is the point: fixed deals reset eventually, and about 2.3 million of them expire during 2027.
That calendar is the reason a modest rate change matters more than its monthly cash value suggests. A borrower moving from an older fixed rate to a current one faces a step up in payment that is decided by the difference between the two rates rather than by the quarter-point alone, and the number of borrowers doing so in 2027 is large.
Lloyds’ Andrew Asaam said demand is being tested by a challenging economic backdrop. The index data support a narrow version of that judgement: transactions and prices respond to affordability first, and affordability is set by rates, incomes and the supply of homes for sale, only the first of which has just moved.
What happens next
November and December readings will show whether the autumn decline accelerates or flattens. The figures published in the new year will carry the first clear signal of how buyers responded to the higher Bank Rate. Mortgage lenders price ahead of the base rate rather than behind it, so the relevant signal for borrowers is the direction of new fixed-rate products over the coming weeks, not the October prices in this index.
For anyone buying, selling or refinancing, the operative numbers are these: £296,285 as the national average, a 1.2 per cent annual fall, a 3.1 per cent fall in London, and a rate rise worth about £30.72 a month to the average tracker holder. What the index cannot show is how many of the 2.3 million borrowers whose deals end in 2027 will choose to sell instead of refinance.