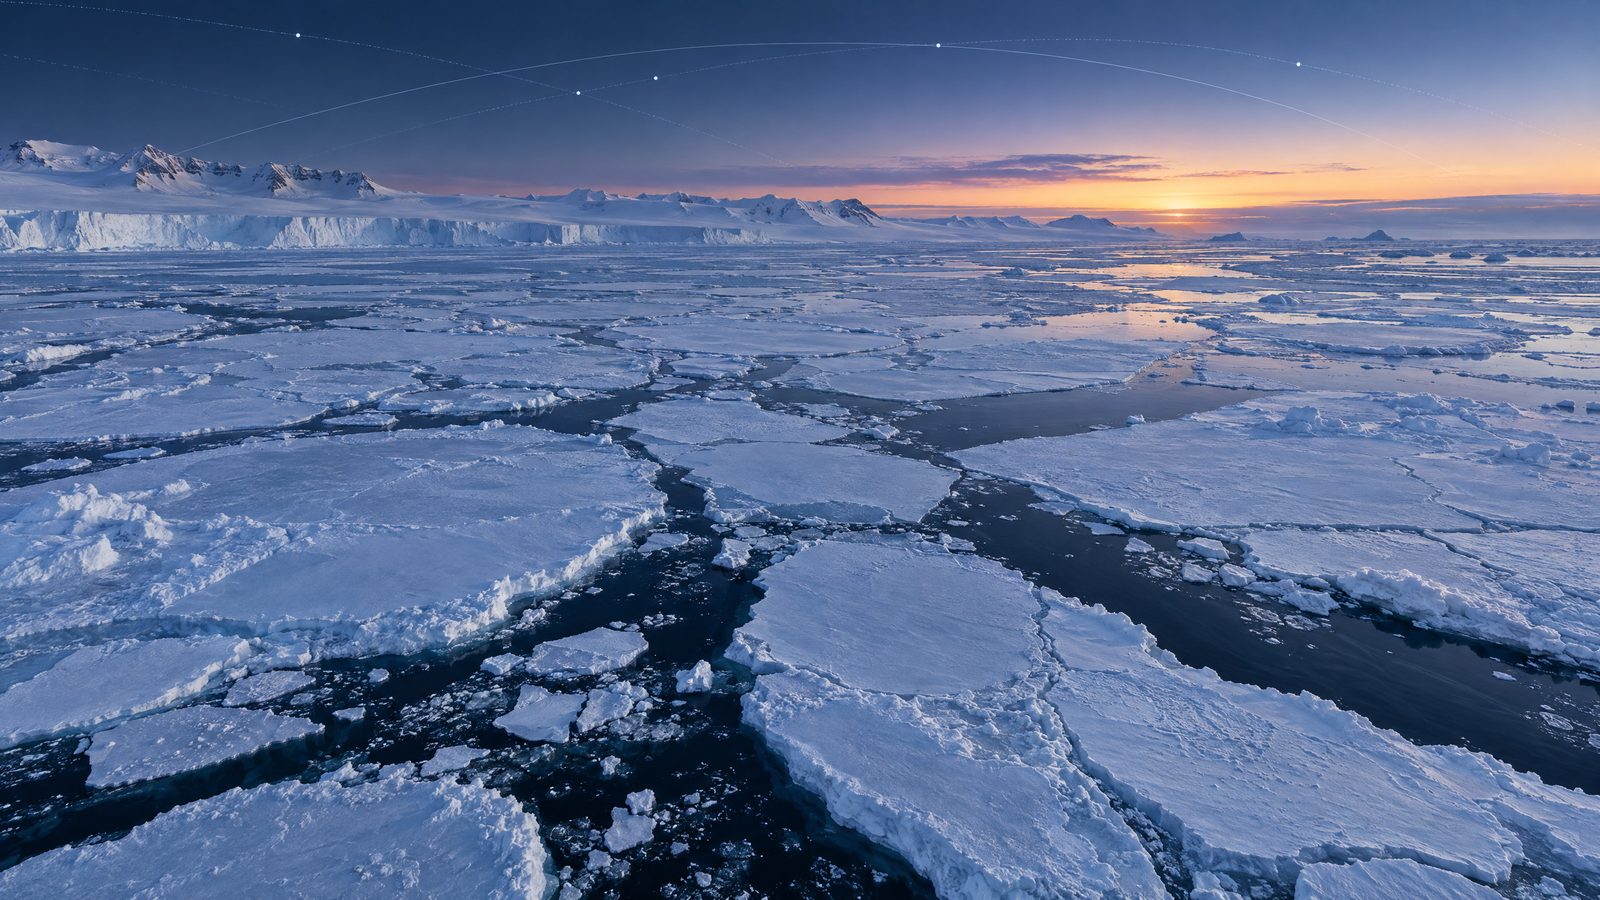

Antarctic sea ice probably reached its winter high for 2026 on 14 September, covering an estimated 17.59 million square kilometres (6.79 million square miles). That would make this the third-lowest maximum in the satellite record, which began in 1978. The estimate is provisional: scientists caution that the date and rank can be difficult to confirm while the ice is still changing near its seasonal peak.
A seasonal high, not a final verdict
The distinction between a likely maximum and a confirmed final value matters. Antarctic sea ice usually expands through the Southern Hemisphere winter, reaching its greatest extent around September, before retreating towards a February minimum. But extent can fluctuate substantially around the peak. A later increase or revised satellite analysis could affect which day counts as the maximum and, in turn, its position in the long-term ranking.
The 17.59 million square kilometre figure is an estimate of sea-ice extent, not a measurement of the area of solid, continuous ice. Scientists generally count a grid area as ice-covered when at least 15 per cent of it contains sea ice. The extent is the combined area of all qualifying grid cells, including water between individual floes. It is therefore different from the actual surface area occupied by ice.
Why satellites can track the ice
Passive microwave instruments measure microwave energy naturally emitted by the Earth. Sea ice and open water produce different signals, allowing scientists to map the boundary even when clouds obscure ordinary visible-light images. The long record combines observations from several generations of satellites: it began with NASA’s Nimbus-7 in late 1978, continued with US defence meteorological satellites from 1987 and later included observations from NASA’s Aqua satellite. Japan’s GCOM-W satellite has contributed observations since 2025.
Keeping the record consistent across instruments is important because the ranking compares this season with nearly five decades of observations. The 2026 estimate is not simply a visual judgement from one image; it is derived from repeated satellite measurements processed into a common measure of extent.
A striking reversal, with causes still unresolved
From 1979 to 2014, Antarctic sea ice increased by about one per cent per decade. That modest rise sat alongside large year-to-year swings, making its significance difficult to interpret. Winter records were set in three consecutive years, from 2012 to 2014, even as Arctic sea ice was declining sharply.
The direction changed after 2014. Antarctic coverage fell markedly from 2016, with occasional rebounds but generally lower-than-normal extent in subsequent years. Both the record-low winter maximum and record-low summer minimum occurred in 2023. The 2026 likely maximum would be higher than that record low, yet still among the three lowest in the satellite series.
That contrast does not, on its own, establish why the decline happened or whether it signals a lasting shift. Scientists are continuing to assess whether the recent pattern represents long-term change or a statistical fluctuation. The evidence supports describing a pronounced fall from the earlier period, not claiming a settled explanation or projecting a guaranteed future trajectory.
What the number can and cannot show
The annual maximum is one indicator of the seasonal reach of Antarctic sea ice. It should be read alongside the summer minimum, the timing of expansion and retreat, and observations over many years. The Antarctic is a continent encircled by ocean, unlike the Arctic, where an ocean basin is surrounded by land. Antarctic ice can spread into surrounding waters during winter and then melt back across a wide area in summer, so its seasonal geography differs from the Arctic’s.
For now, 17.59 million square kilometres offers a clear measure of a low winter peak, while the qualification “likely” remains essential. Continued observation will determine whether the 14 September date holds and how the season fits into a record marked by both substantial natural variability and a sharp recent decline.