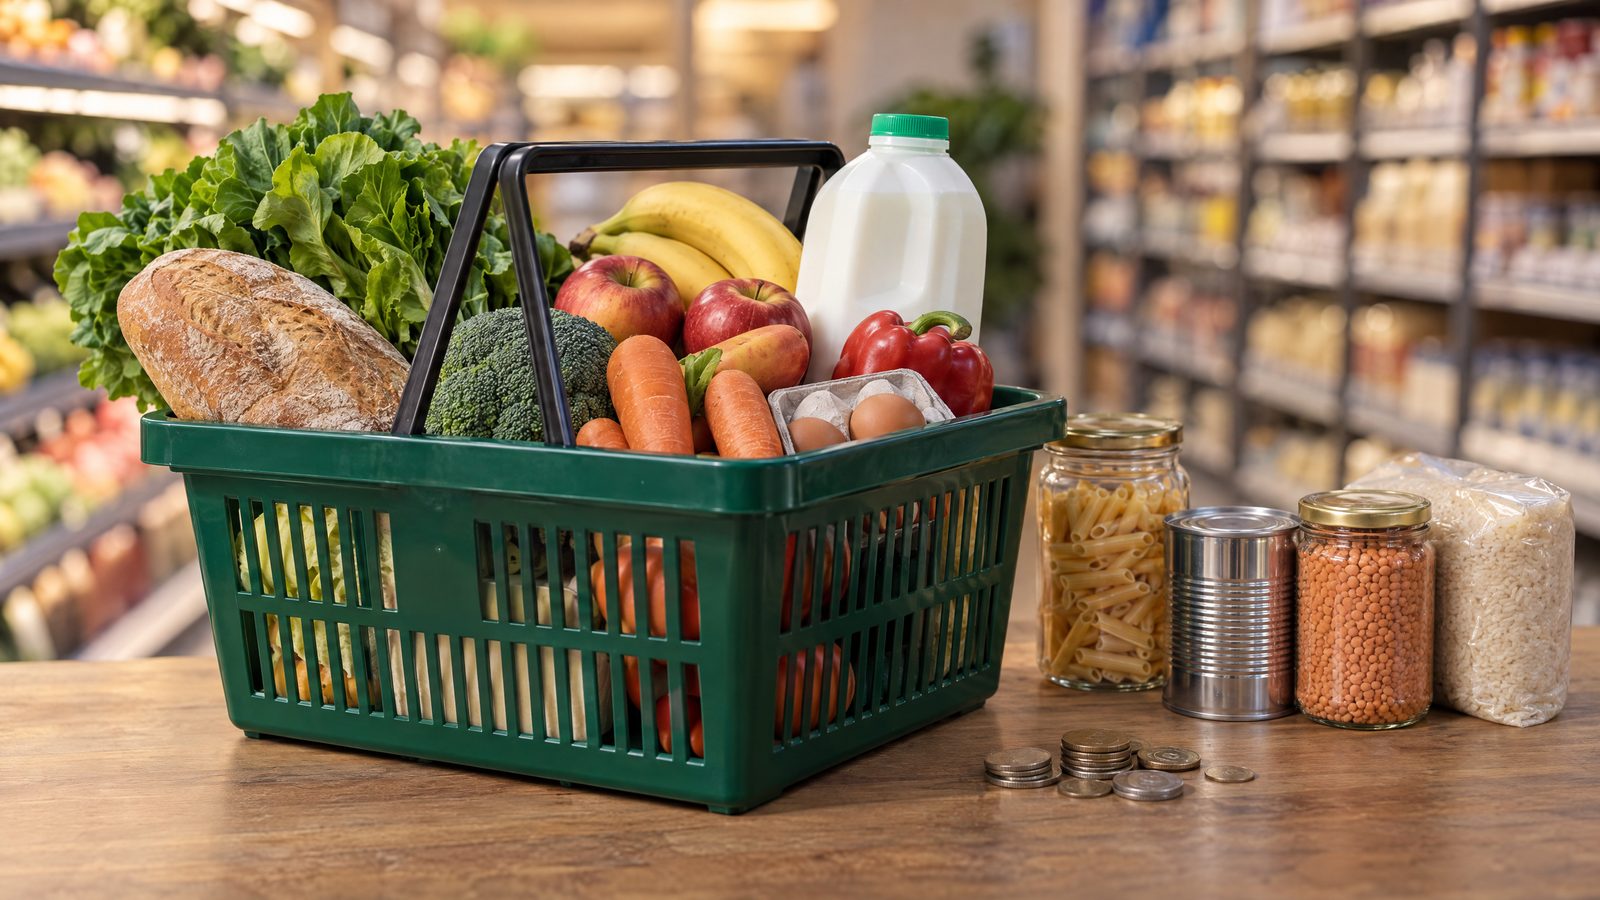

UK grocery price inflation rose to 2.5% in the four weeks to 4 October, up from 2.3% in the previous four-week reading, while take-home grocery sales grew by 1.0% year on year. The figures point to continued pressure on household budgets and a market in which shoppers and retailers are relying on promotions and competing for share.
A modest rise, not a monthly price jump
The 2.5% figure is an annual comparison of grocery prices across the market-research panel, not a claim that supermarket prices climbed by 2.5% during September. It is also not the Office for National Statistics’ headline consumer price inflation measure. The two series use different baskets, methods and reporting periods, so they should not be treated as interchangeable. The next official inflation release was scheduled for 21 October.
Within the grocery basket, water, cordials and skincare were among the quickest-rising categories. Butter, cheese and chocolate were among those falling fastest. A category movement does not mean every product changed by the same amount: brands, pack sizes, promotions and the mix of items people buy all affect what shoppers encounter at the till.
Promotions remain a prominent part of that picture. Worldpanel said spending on grocery offers in the latest month was more than £250 million higher than a year earlier. That is the additional money spent on promoted purchases, not evidence that discounts themselves necessarily became deeper. More items may have been bought on offer, or shoppers may have shifted towards different products and price points.
Sales value and shopping volume are not the same
Take-home grocery sales increased 1.0% over the four weeks compared with a year earlier. Because the price measure rose faster, the figures suggest shoppers bought less in volume terms overall. But subtracting 1.0% from 2.5% does not produce an exact volume decline. The sales and inflation measures have different construction, and changes in product mix, pack size and what households choose to buy can alter the relationship between spending and quantities.
That distinction matters for households as well as food businesses. Rising till receipts can coexist with fewer units sold, and a household may manage its budget by switching brands, buying smaller packs or taking advantage of offers. The aggregate figures do not reveal how any one family has changed its shopping, nor do they show that every grocery bill has risen at the same rate.
Retailers compete on different fronts
Over the separate 12 weeks to 4 October, Lidl’s sales were 7.1% higher than a year earlier, and its share of the market rose to 8.6%, from 8.2%. Ocado recorded 12.4% sales growth and increased its share to 2.2% from 2.0%. Those results sit alongside more modest growth at Tesco, up 1.0%, and Sainsbury’s, up 1.3%. Tesco’s 27.8% share edged down from 27.9%, while Sainsbury’s share was 15.2%, compared with 15.3% a year before.
These 12-week comparisons provide a view of competitive performance, not a direct explanation of the four-week inflation increase. A retailer’s sales growth can reflect customer numbers, frequency, volumes, prices and the products purchased. It should not be read as a like-for-like measure of how much prices rose at that chain.
Marks & Spencer’s grocery sales rose 14.9%, but the figure is not directly comparable with the supermarket market-share table. Its wider clothing and general merchandise mix means it is excluded from the table’s definition of grocers; the stated growth refers to its fast-moving consumer goods sales.
What the figures can and cannot tell shoppers
The latest reading offers a timely snapshot as retailers and suppliers plan for the autumn and Christmas period. Lower chocolate prices compared with a year earlier may help shoppers facing seasonal purchases, while stronger promotional spending indicates that offers remain important to how grocery money is spent. Yet a lower category price does not establish that manufacturers’ costs or suppliers’ margins have fallen.
For households, the broadest lesson is that the headline rate is an average across a varied basket. Individual experience depends on the goods bought and the offers available. For retailers, the sales and share data show that performance differs substantially across the market. Neither set of figures provides a complete account of household affordability, but together they show why price, units sold and promotional activity need to be considered separately.