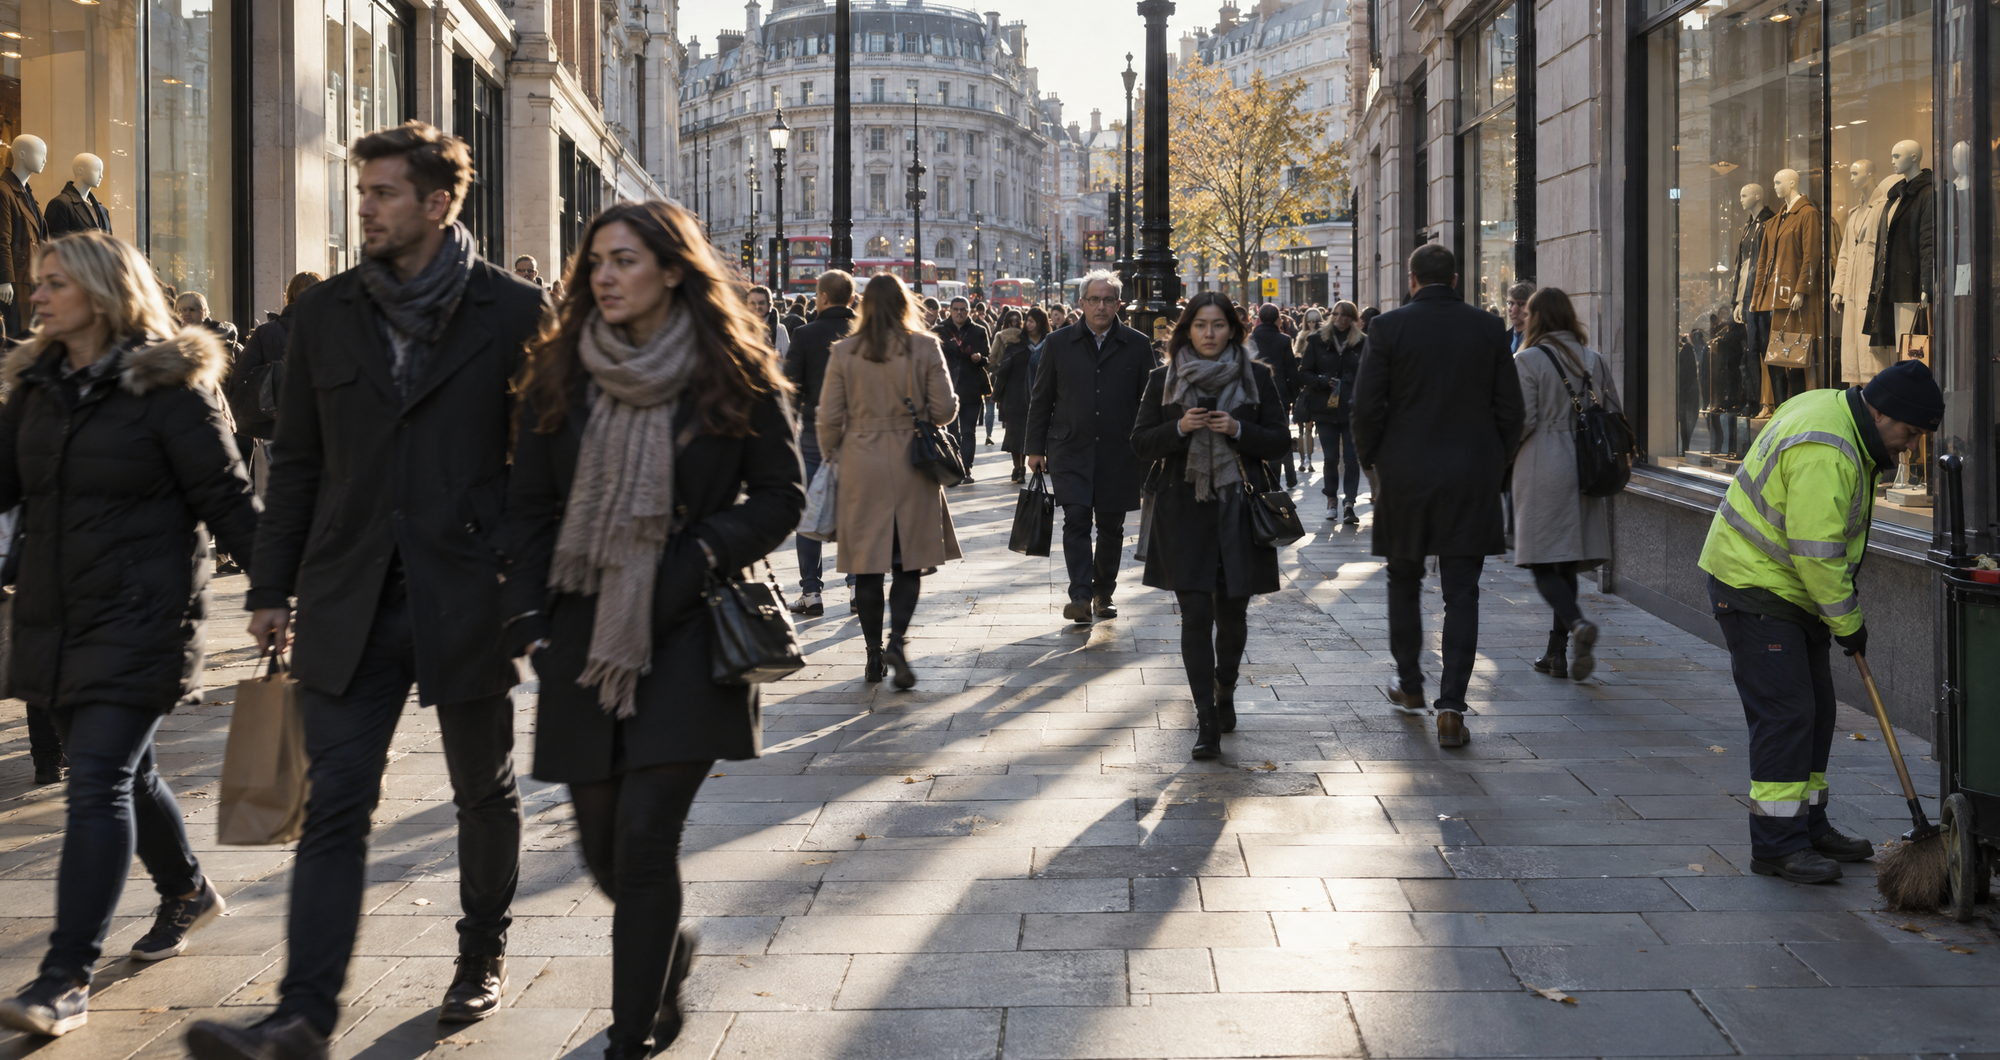

Card payment data from 40 shops on Oxford Street shows the value of spending there rose 28 per cent in the seven days from 26 October, the first week in which almost a kilometre of the street was closed to traffic. Total spending at the same shops was 12 per cent higher than in the week before the closure. The figures were released on 4 November.
The number of transactions rose 19 per cent on both the previous week and the same week in 2025. Spending value therefore grew faster than transaction numbers, which means the average purchase was larger than a year earlier. The two measures answer different questions. Spending value records how much money changed hands and is affected by price and by the size of each basket. Transaction volume records how many purchases were made. A street can post a strong gain in value while serving the same number of customers, and it can post a strong gain in transactions while taking less money per head.
What the figures cover
The sample is narrow, and the caveats matter as much as the headline numbers. The data covers 40 stores on one street, is supplied by a single payments company, Adyen, and runs for one week. It is not an official statistic. Payments processed by other providers, and cash, fall outside it, as do shops that are not among the 40. The figures are an early indicator of direction rather than a measure of the street’s total turnover, and they cannot show whether spending rose because more people came, because those who came spent more, or because prices were higher.
Almost one kilometre of Oxford Street has been closed to cars, buses, taxis and bicycles since 26 October. Deliveries are confined to between midnight and 7am. The closure forms part of a £150m transformation of the street, which is due to end with a permanent layout by November 2027.
The wider case
Greater London Authority economists estimate that the completed scheme could add up to £82m a year in extra output and support more than 700 jobs. Those are forecasts for the finished street, not measurements of its first week, and they sit against a £150m outlay. The card figures give the forecast its first piece of supporting evidence. They do not test it.
The experiment is among the most contested in the capital. The terms of the closure, which excludes bicycles as well as motor vehicles and limits deliveries to a seven-hour window overnight, have made the street a test case for how far central London should go in removing traffic from shopping districts. Whatever the card data shows, those terms are what the street will be judged on when the permanent layout is agreed.
What happens next
A permanent layout is due by November 2027. Before then the Christmas trading period will offer a larger test of whether the first week’s gains hold, covering more shops and a longer stretch of the calendar than seven days in late October. Because the same 40 shops can be tracked again, later releases from the same payments company will be comparable with this one, which makes the next set of figures more useful than the first.
For shoppers, the immediate change is practical. There is no through traffic on the closed section, and deliveries are concentrated overnight. For the businesses in the sample, the question is whether a stronger first week becomes a stronger quarter, and whether the uplift survives the point at which the street stops being a novelty.
What remains unresolved is representativeness. Forty shops out of several hundred, one payments provider, seven days of trading: the direction of travel is clear enough, the scale is not.